Statistics Canada splits culture into nine domains. Divide each one’s GDP by its jobs and the two at the bottom are the ones you watch in person: live performance and heritage. The figure measures what a domain produces per job, not what anyone in it is paid.
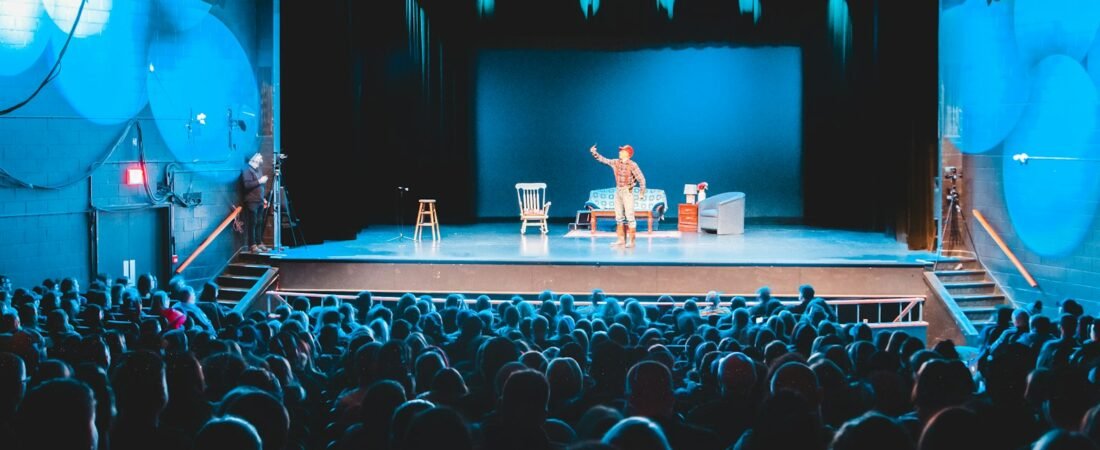
A theatre seat. A festival field. A room in a small museum. These are the parts of culture that happen in front of you, with a person doing the work in the same room.
They are also the parts that register the least output per job in Canada’s official culture accounts. In 2024, live performance produced $54,204 of gross domestic product for every job it counted. Heritage and libraries produced $55,529. The average across all of culture was $96,364. The top domain, a grouping Statistics Canada calls “multi domain”, reached $152,697.
None of those four figures appears in the source. Statistics Canada publishes GDP and jobs in separate columns of table 36-10-0452-01. Raw POV downloaded the full file and did the division.
What the culture indicators measure
The Provincial and Territorial Culture Indicators come out once a year. The 2024 edition was released on June 2, 2026. Culture GDP rose 4.0% to $67.1 billion. Culture jobs rose 2.1% to 696,359, or 3.3% of all jobs in the country.
The release uses what the agency calls the product perspective. Activity is grouped by what gets made, not by which industry made it. A book counts as books whether a publisher or a printer produced it, as the program description explains.
GDP divided by jobs gives value added per job, which is a measure of output. The table counts jobs, not people, and it does not say how many of those jobs are full time. So a low figure says a domain adds less value per position. It says nothing about what the person in that position takes home.
For scale: culture is 8.1 times the size of sport in GDP and 6.7 times its size in jobs, on the same table.
Nine culture domains, ranked by GDP per job
| Domain (2024) | Jobs | Share of culture jobs | Share of culture GDP | GDP per job |
|---|---|---|---|---|
| Live performance | 75,368 | 10.8% | 6.1% | $54,204 |
| Heritage and libraries | 19,751 | 2.8% | 1.6% | $55,529 |
| Education and training | 61,726 | 8.9% | 7.5% | $81,408 |
| Written and published works | 92,958 | 13.3% | 11.3% | $81,898 |
| Visual and applied arts | 159,926 | 23.0% | 22.4% | $94,184 |
| Sound recording | 5,542 | 0.8% | 0.8% | $97,831 |
| Audio-visual and interactive media | 172,421 | 24.8% | 30.0% | $116,590 |
| Governance, funding and professional support | 97,083 | 13.9% | 17.6% | $121,623 |
| Multi domain | 11,584 | 1.7% | 2.6% | $152,697 |
The nine rows add up exactly to the published culture total, $67,103,685 thousand and 696,359 jobs. That check matters. The same table also lists sub-domains under their parents, and mixing the two levels would count the same work twice.
From bottom to top, the spread is 2.82 times. The shares column tells the same story another way. Live performance holds 10.8% of culture jobs and 6.1% of culture GDP. Audio-visual and interactive media holds 24.8% of the jobs and 30.0% of the GDP. One domain employs more than its economic weight. The other weighs more than it employs.
Two footnotes change how the ends of the table read.
First, heritage. The table’s notes say the heritage and libraries domain includes private institutions only. Museums, archives and libraries run by any level of government are counted under governance, funding and professional support, which sits near the top at $121,623. The heritage line describes privately run heritage, not the public library down the street.
Second, the top. Multi domain holds industries that serve several parts of culture at once. The notes list the culture share of convention and trade show organizers, manufacturing and reproducing unrecorded media, lessors of intangible assets, and internet broadcasting and web search portals. None of that happens on a stage.
This is the same kind of reading we did with the Parks Canada attendance file: take the agency’s own columns, put them side by side, and see where the weight sits.
Crafts inside visual and applied arts
Visual and applied arts breaks into seven sub-domains. Their rows also add up exactly to the parent. The same shape shows up one level down. Art reproductions sits at the bottom, at $60,700 per job. Architecture sits at the top, at $133,378. The spread is 2.20 times.
Crafts lands in the middle, at $98,006 per job. In 2024 it counted 28,359 jobs and $2.78 billion in GDP.
Crafts also moved against the rest of the table. It was the only one of the seven visual and applied arts sub-domains to shrink in 2024. Its GDP fell 3.3% and its jobs fell 2.9%. Over the same year, culture as a whole grew 4.0% in GDP and 2.1% in jobs. The parent domain grew 3.3% and 1.8%.
The longer view is quieter. Crafts had 29,732 jobs in 2019. In 2024 it had 28,359, which is 4.6% fewer. Culture as a whole had 6.2% more jobs than in 2019.
The category is tidier in the table than in the studio. In 2021 the Canadian Crafts Federation published The Craft Spectrum, a paper that deliberately avoided a single fixed definition of craft. Maegen Black, the federation’s director at the time, said the aim was to leave makers room to find their place, “rather than a set mould you must adapt to,” as Galleries West reported. The paper maps nine areas that shape craft, from technology to cultural exchange to the economy.
A national account cannot do that. It needs one box per product. Worth remembering when reading the crafts line.
Skills in the trades pass from hand to hand too, and they show up in other Statistics Canada files. Our reading of the apprenticeship data found that for every apprentice who certifies on time, 1.55 leave.
Live performance jobs are back to 2019, and no further
The table goes back to 2010, so the pandemic years are in it.
In 2020, live performance jobs fell 30.1% from 2019. Culture as a whole fell 16.6%. By 2024, live performance counted 75,368 jobs. In 2019 it had counted 75,433. That is 65 fewer, which is close to even.
Culture overall, over the same five years, added 6.2%. So live performance recovered its own ground, but its share of culture jobs slipped, from 11.5% in 2019 to 10.8% in 2024.
Its nominal GDP is 20.1% above 2019. Those are current dollars with no adjustment for inflation, so the number is not a real gain and should not be read as one.
A stage career runs on long arcs that no annual table can show. The story of Brazilian songwriter Joyce Moreno, whose career outlasted a dictatorship, is one of them.
What the data cannot show
Two things, and both matter.
The indicator does not measure pay. GDP per job is value added divided by a count of jobs. A domain with many part-time or short contract positions will show a low figure even if each hour is well paid. A domain with a few highly paid positions and heavy equipment will show a high one. The table does not separate these cases.
The table also does not say why. It reports GDP and jobs. It does not report the reasons behind the ratio, and this article does not supply one. A low number here is not a failure and is not written as one.
One more limit. Statistics Canada also organizes these indicators by industry rather than by product. Figures from that view can differ, so the ratios above belong to this table only.
Frequently asked questions
How big is the culture sector in Canada’s economy?
Statistics Canada puts culture GDP at $67.1 billion in 2024, up 4.0% from 2023, with 696,359 jobs, or 3.3% of all jobs in Canada.
Which culture domain produces the most GDP per job in Canada?
By Raw POV’s calculation from table 36-10-0452-01, multi domain leads at $152,697 per job in 2024. Live performance is lowest at $54,204. The culture average is $96,364.
Is GDP per job the same as salary?
No. GDP per job is the value a domain adds divided by the number of jobs it counts. It does not measure what workers earn, and the table does not separate full-time from part-time jobs.
Sources and method
From the source. All GDP and jobs figures come from Statistics Canada, table 36-10-0452-01, “Culture and sport indicators by domain and sub-domain, by province and territory, product perspective”, Canada level, 2010 to 2024, read from the full CSV download on September 24, 2026. GDP is nominal, in current dollars. The notes on heritage (private institutions only) and on the contents of multi domain are the table’s own footnotes. The 2024 headline totals match The Daily of June 2, 2026. The description of the product perspective is from the survey program page. Maegen Black’s statement and the description of The Craft Spectrum are from Galleries West, September 6, 2021.
Raw POV analysis. Every GDP per job figure, every share of culture jobs and GDP, the 2.82 and 2.20 spreads, the culture to sport ratios, and all year over year and 2019 to 2024 changes were calculated by Raw POV. Statistics Canada does not publish them in this table. We compared domains only within one level of the hierarchy, using the parent codes in the table’s metadata file, and confirmed that each level sums exactly to its published total. Comparisons across years use nominal figures and are not adjusted for inflation.